Analyzing the FTDNA TiP Calculator Results
Part 1
by Ed Ralston
The FTDNA TiP tools gives results that shows probability that a common ancestor was WITHIN x generations. By applying some math to the results, we can calculate the probability for a particular generation by finding the increment, or the difference of the probabilities for each generation:
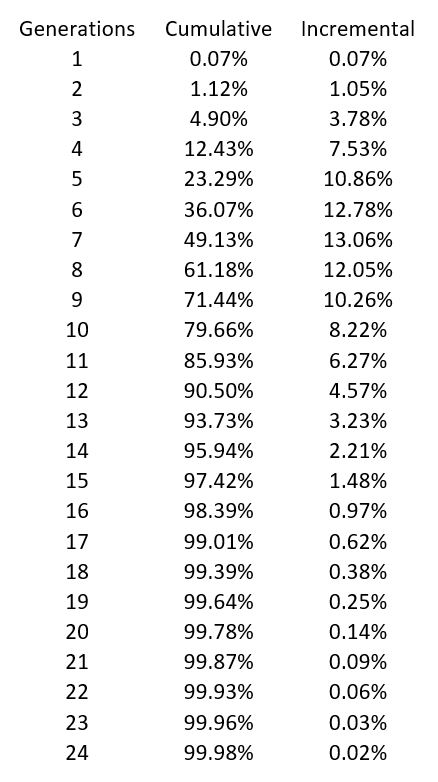
The column labeled “Incremental” shows the probability for a particular generation, the red line in the graph below. In this case note that the greatest chance are in five to nine generations as the following graph illustrates:
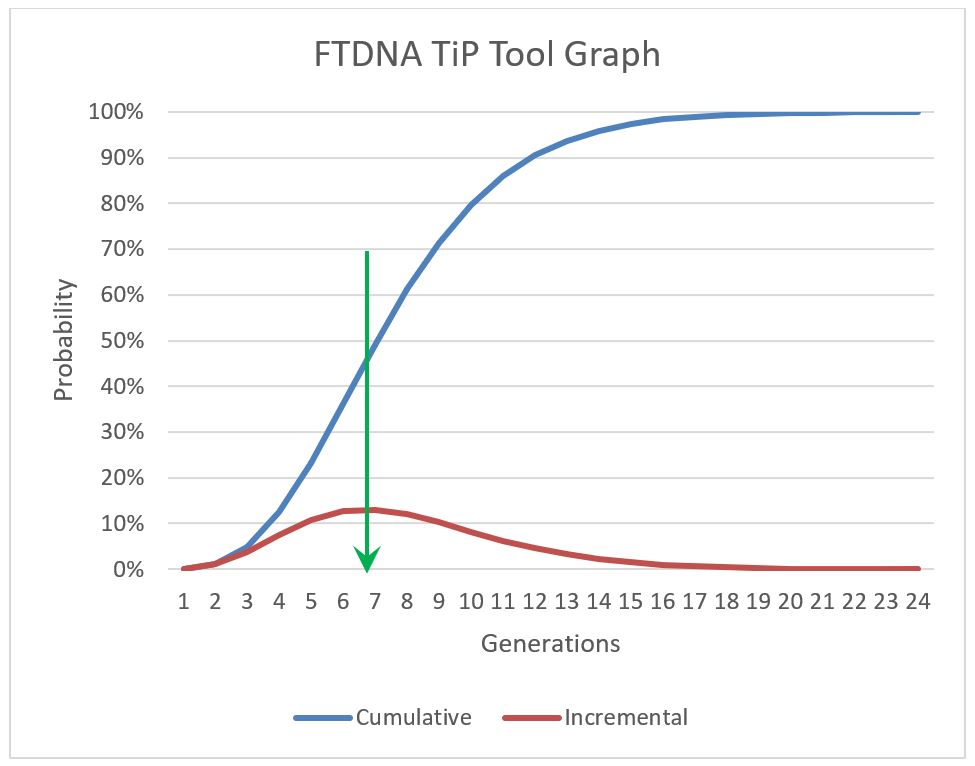
The area under the red line represents all possible results. As was noted in the data, the “peak” of the incremental line is close to seven generations, as shown by the green arrow above. Note that this is close to where the blue cumulative line crosses the 50% line. At that point, half the possible results are to the left, half to the right of the dotted line. Some people argue this, “At the 50% you only have a 50-50 chance of your ancestor’s generation being at that point.” They claim it is much better to use a much higher percentage for more accurate results, like 95%.
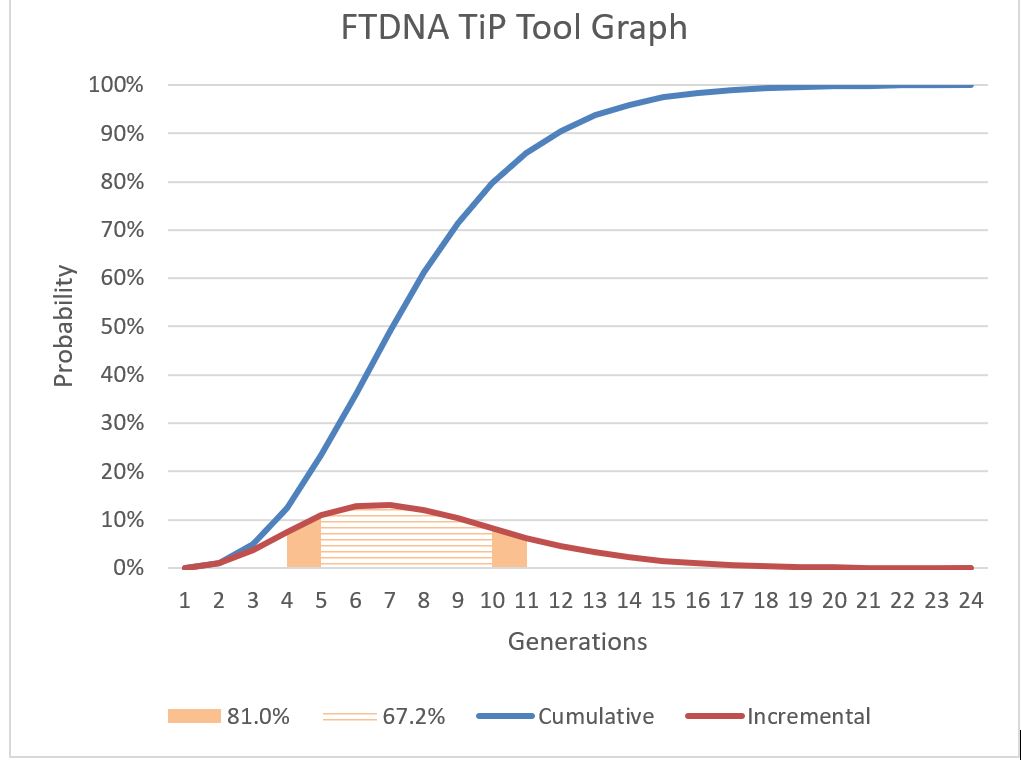
This is true if you are wanting assurance that an ancestor is at or less than a particular point. If that were the case, then by picking the highest possible generations back will give the highest assurance. But, I contend, we are not wanting a guarantee that our common ancestor was less that x generations ago – we are looking for the number of generations that has the highest probability. If you look at a range of generations, the graph below shows there is an 67% chance the common ancestor was in the 5 to 10 generation range and 81% in the 6 to 11 range.
If you take all the possible results and put them in a pie chart, it looks like this:
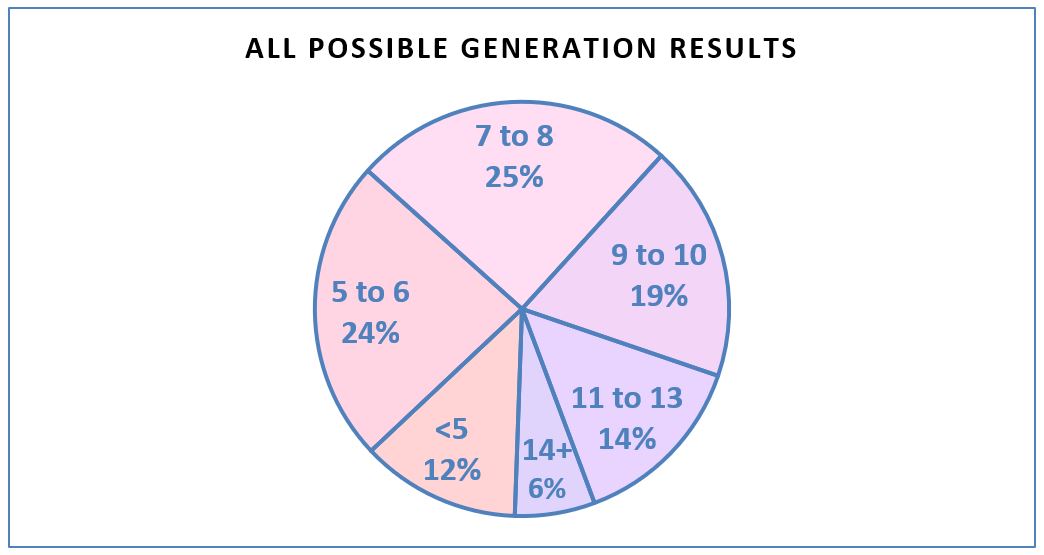
Notice in this graph that almost 50% of the results fall between 5 and 8 generations, and 68% in 5 to 10. If we had chosen to assume our ancestor was at the 95% level (14 generations) we would have been choosing the lowest probability on the graph.
But suppose we know our own genealogy and/or know the genealogy of our match and know we do not share a common ancestor within x generations. FTDNA allows for that possibility in the input data for the TiP tool. See Analyzing TiP Results - Part 2 for that discussion.